Layer provides a full set of accounting charts and table reports that you can embed directly within your platform. You can use these reports to give your customers a clear picture of their business profitability, cash flows, and balance sheet. There are two ways to offer reporting within your platform:
  • Embedded UI components - Embed Layer’s charts and report UI components within your experience.
  • API - Call Layer’s API directly to build your own accounting reports.

Embedded components

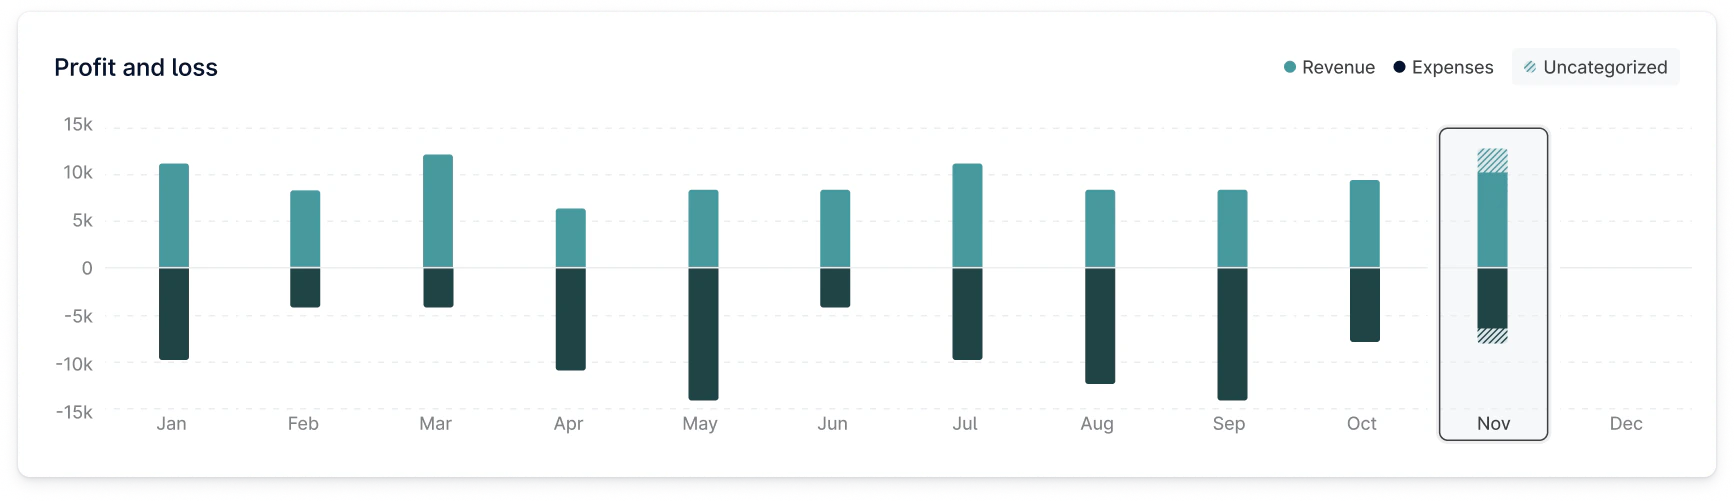
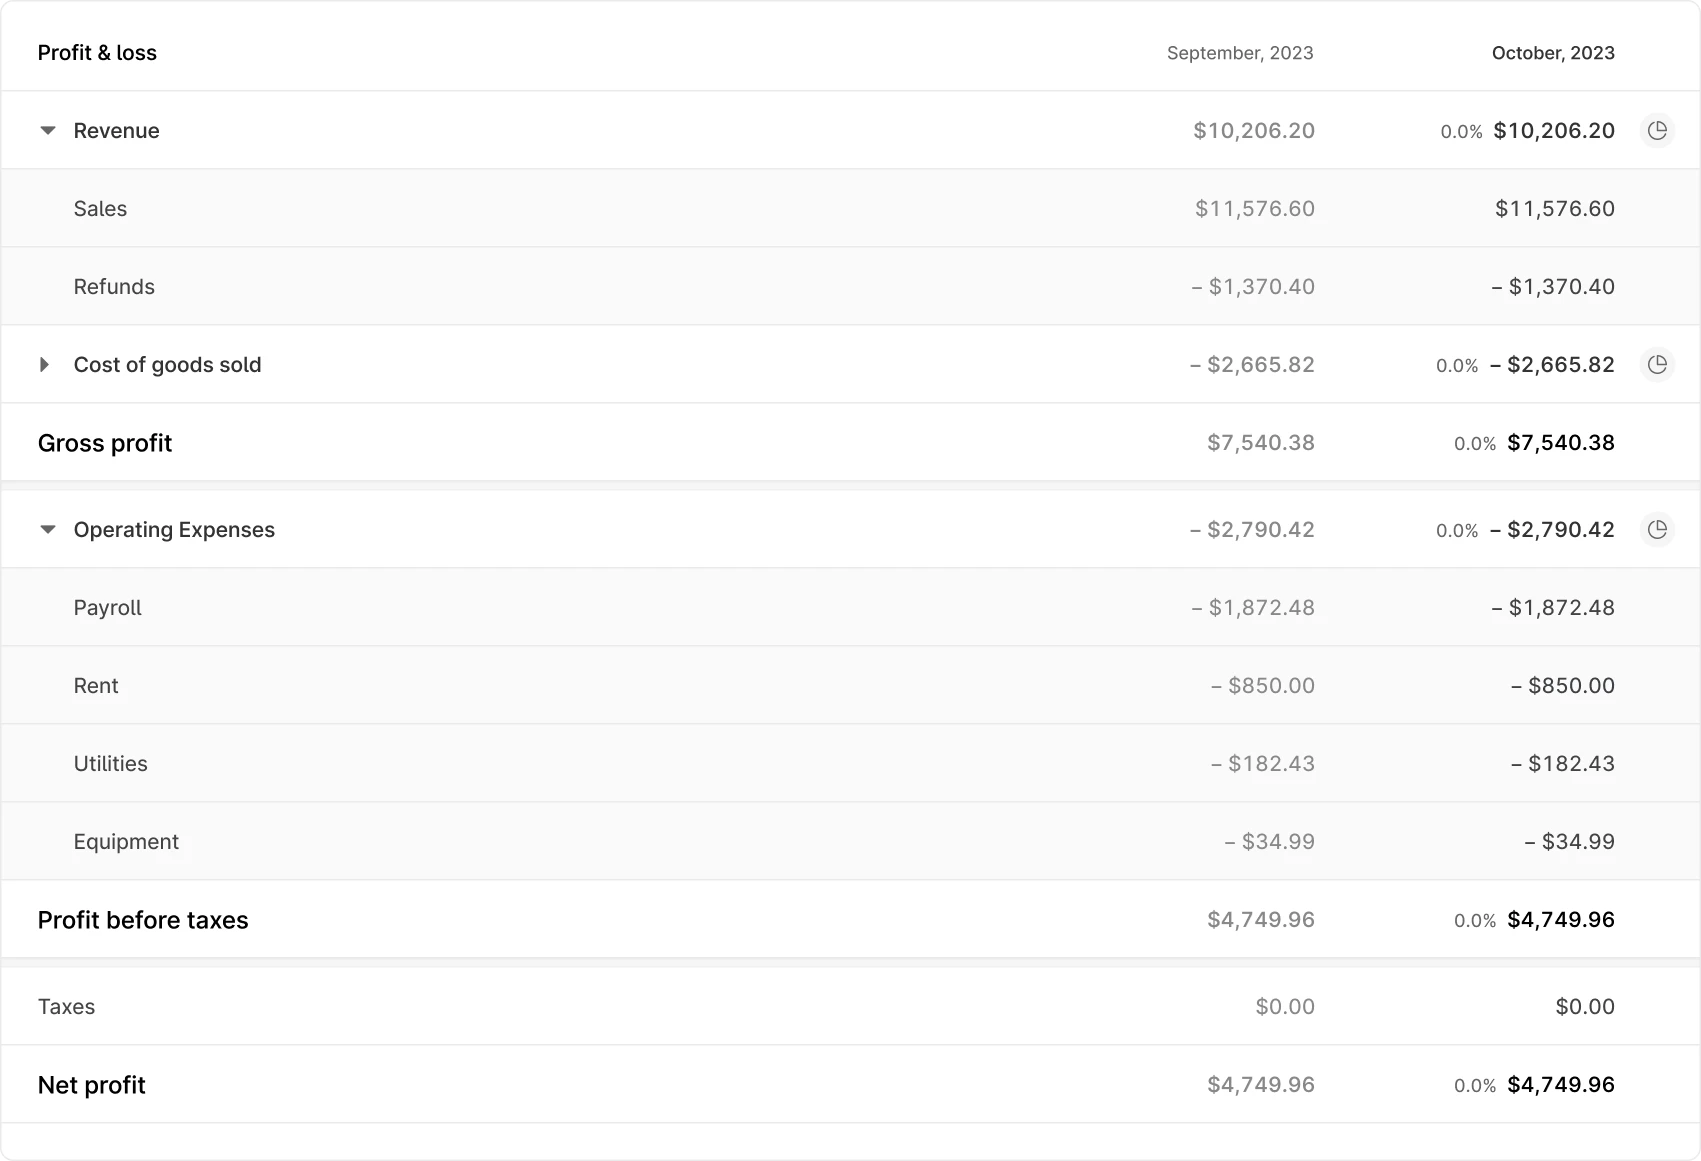
Layer provides a variety of chart and table report UI components that you can download via npm and embed directly within your frontend. Below are some examples: Profit & Loss chart Profit & Loss chart Profit & Loss table Profit & Loss table More detail on using Layer’s embedded UI components is available here. Reach out to your Layer contact for a full list of embedded reporting components.
API

Retrieving a Profit & Loss report

To build your own Profit & Loss report UI make a call to the retrieve a Profit and Loss Report endpoint.
The start_date query string parameter is required for all calls to the Retrieve a Profit and Loss Report endpoint.
Request
The API will respond with the generated [Profit and Loss Report](/api-reference/pnl/pnl.
Response
You can use this data to build your own profit and loss report UI within your platform.

Supported reports

A full list of supported reports is available in the API reference